Business Metrics and KPIs That Actually Drive Profit: Small Business Guide 2025
Stop drowning in vanity metrics. Learn which business KPIs actually predict profitability and growth for your small business in the US market.
Are you checking your Instagram likes, website traffic, and follower count, but still scratching your head about why your bank account isn’t growing? Welcome to the “vanity metrics trap” – where most small business dreams go to die.

Having tons of data is useless if you don’t know which numbers actually predict your profitability and growth. The right business metrics and KPIs for small business are your GPS to sustainable profit.
At MiNegocioTop.com, we believe clarity equals power. This isn’t an endless list of acronyms. It’s a filter. We’ll teach you the crucial difference between a “metric” and a “KPI” and give you the essential dashboard with the 5-7 key indicators you need to pilot your business with expert confidence, no MBA required.
The Diagnosis: Why US Small Businesses Operate Blind Despite Having All the Data
The problem isn’t lack of information – it’s lack of wisdom. According to the Small Business Administration (SBA), 70% of small businesses fail because they can’t track what matters. Here are the symptoms we see in every business forum:
Analysis Paralysis
You have access to Google Analytics, QuickBooks reports, Square dashboard, Facebook Insights… So many numbers that it’s easier to ignore them all. You end up running on gut feeling instead of implementing data-driven processes.
Vanity Metrics Addiction
You celebrate spikes in “likes,” follower counts, or website visits. They feel good, but they don’t pay the bills. They’re not directly correlated with your bottom line. You need to focus on digital marketing strategies that generate real conversions.
Disconnected Information Silos
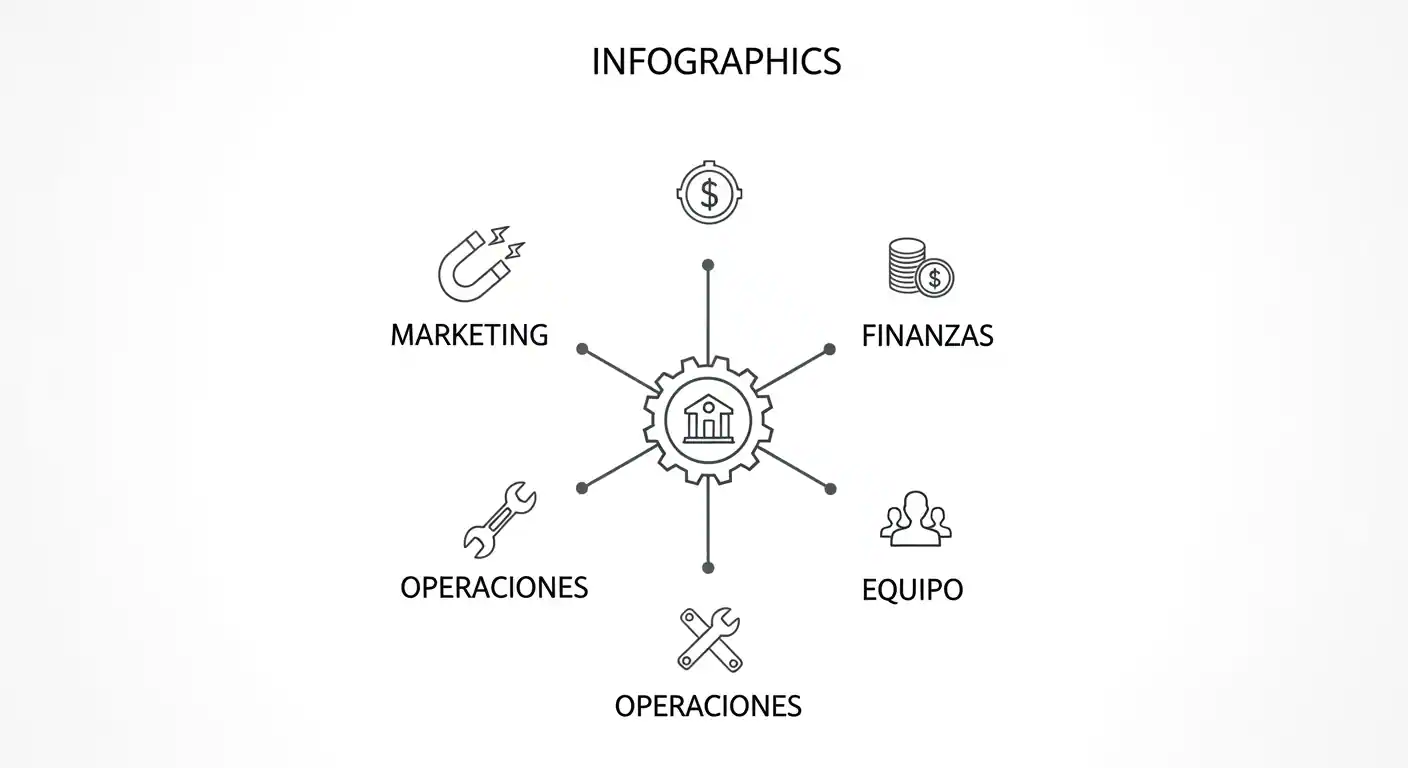
Your marketing team celebrates a “successful” campaign because it generated high traffic, but your finance team sees no increase in profit margins. Each department measures their own stuff, but nobody sees the big picture. This is where effective team management makes the difference.
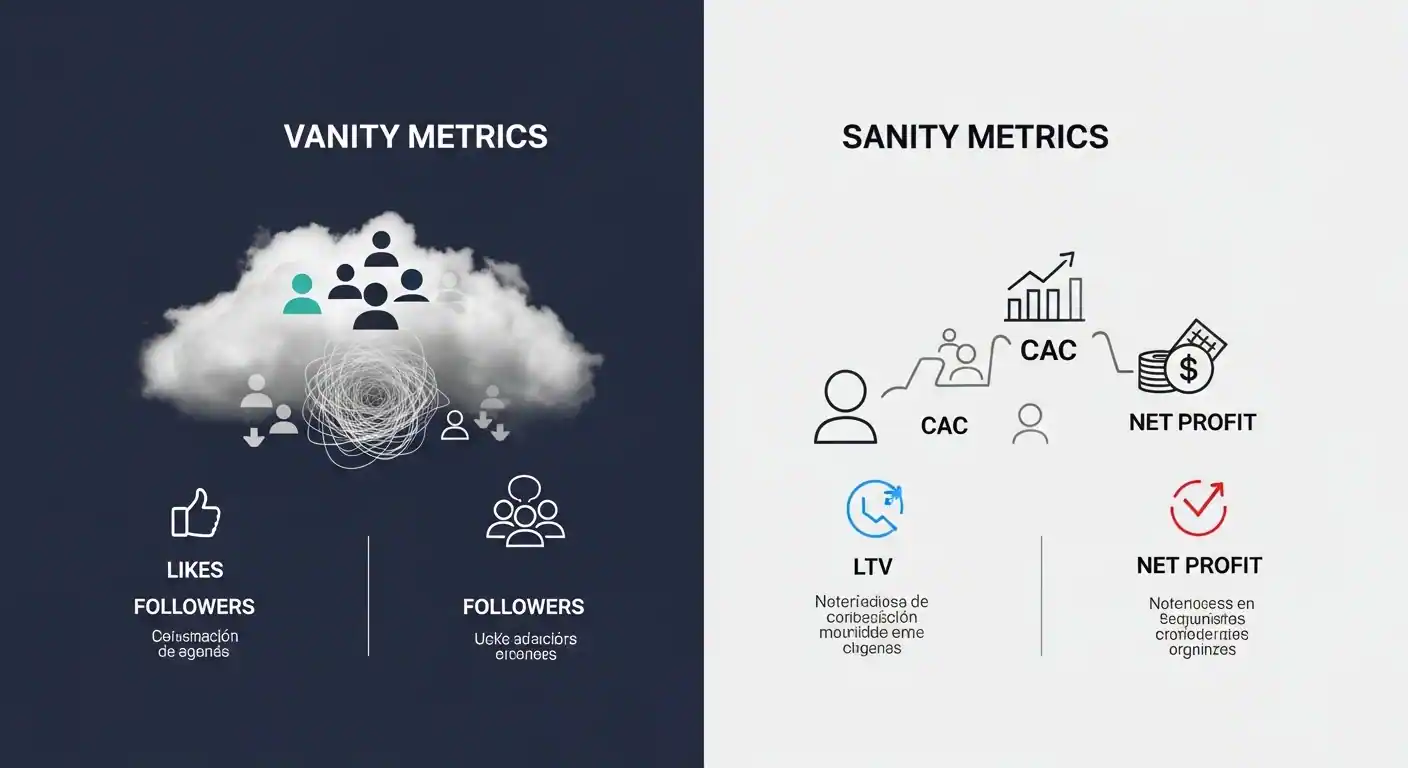
⌠Vanity Metrics
- Social media followers
- Likes and comments
- Page views
- Time on site
- Brand mentions
✅ Sanity Metrics
- Customer Acquisition Cost (CAC)
- Customer Lifetime Value (CLV)
- Conversion Rate
- Profit Margins
- Return on Investment (ROI)
The Game-Changing Difference: Metric vs. KPI
The Golden Rule:
A Metric measures almost anything (e.g., number of followers).
A KPI (Key Performance Indicator) measures something directly tied to a critical business objective (e.g., follower-to-customer conversion rate).
Every KPI is a metric, but not every metric is a KPI.
This distinction is fundamental for creating an effective content strategy that actually moves the needle for your business.
Your Essential Dashboard: The KPIs That Actually Matter
Marketing & Sales KPIs: Are We Attracting the Right Customers?
What it tells you: How much money it costs you, on average, to acquire one new customer through your social media marketing strategies.
How to calculate:
CAC = Total Marketing & Sales Investment / Number of New Customers
Industry benchmark: Most successful US small businesses keep CAC below 20% of CLV.
What it tells you: How much revenue, on average, a customer generates during their entire relationship with your business. Optimizing this KPI through customer retention strategies is crucial.
The golden rule: Your CLV should always be significantly higher than your CAC (ideally 3:1 ratio).
What it tells you: The percentage of prospects who take a desired action (purchase, subscribe, book appointment). Improving this KPI requires optimizing both your SEO strategy and value proposition.
Conversion Rate = (Conversions / Total Visitors) × 100
???? CAC & CLV/CAC Ratio Calculator
Discover if your business is financially sustainable:
Financial KPIs: Are We Actually Profitable?
What it tells you: The money left from each sale after subtracting the direct costs of producing/selling your product or service. Clear financial management is essential to optimize it.
Gross Margin = ((Revenue – COGS) / Revenue) × 100
US Small Business Benchmark: Healthy gross margins range from 50-70% for service businesses, 20-40% for retail.
What it tells you: The percentage of actual profit left after paying ABSOLUTELY EVERYTHING. This is the truth KPI. To master it, you need a comprehensive financial strategy.
Net Margin = (Net Profit / Total Revenue) × 100
What it tells you: How much actual cash flows in and out of your business month to month. You can be profitable on paper but run out of cash to operate. Learn to manage your cash flow effectively.
Survival rule: Always maintain at least 3 months of operating expenses in reserve.
US Market Focus: Which KPI Should Be Your Priority?
Focus: Aggressive Growth & Scalability
Priority KPIs: CAC and CLV. In these highly competitive markets, the key is profitable growth. Sales funnel efficiency is an obsession that requires well-defined marketing automation strategies.
Focus: Efficiency & Profit Optimization
Priority KPIs: Net Profit Margin and Operating Cash Flow. In mature markets with high operational costs, profit per operation is vital. Implementing AI to automate processes can make the difference.
Focus: Market Share & Customer Retention
Priority KPIs: Conversion Rate and Customer Retention Rate. In growing markets, capturing and keeping customers is more cost-effective than constantly acquiring new ones.
???? Create Your Personal KPI Dashboard
Select your business type and we’ll recommend the 3 most important KPIs:
Practical Implementation: Your 30-Day Action Plan
????ï¸ Week 1: Audit and Clean-Up
- Day 1-2: List all the data you currently monitor
- Day 3-4: Classify each metric as “Vanity” or “Actionable”
- Day 5-7: Eliminate 80% of vanity metrics from your reports using continuous improvement principles
???? Week 2: Critical KPI Selection
- Day 8-10: Define the 3 most important objectives of your business based on your strategic planning
- Day 11-12: Select 1-2 KPIs per objective (maximum 6 total KPIs)
- Day 13-14: Set specific targets for each KPI
???? Week 3: System Setup
- Day 15-17: Set up tools to measure automatically using AI solutions when possible
- Day 18-19: Create your visual dashboard (Excel, Google Sheets, or QuickBooks)
- Day 20-21: Establish review frequency (weekly/bi-weekly)
???? Week 4: Action and Optimization
- Day 22-24: Implement improvements based on initial data
- Day 25-26: Adjust processes that directly impact KPIs
- Day 27-30: Evaluate and refine your metrics system with your team
Frequently Asked Questions About Business Metrics and KPIs
Ready to Transform Your Business with Smart Data?
At MiNegocioTop.com, we’re more than an information source. We’re your strategic partner on the path to sustainable profitability. Discover how to integrate these KPIs with profitable digital marketing strategies.
All our content is and will always be FREE.
Because we believe in democratizing access to knowledge that truly transforms businesses. Explore our business strategy center for more resources.