 Skip to content
 Business Process Mapping & Bottleneck Analysis
The definitive guide to streamline operations, eliminate workflow bottlenecks, and boost your small business ROI by 40%
Create Your Process Map Now???? The Bottom Line You Need to Know
Business process mapping is the strategic practice of visualizing your company’s workflows to identify inefficiencies, eliminate bottlenecks, and optimize operations for maximum profitability. For small and mid-sized businesses across America, this methodology can increase operational efficiency by 25-40% without additional capital investment.
A bottleneck is any step in your workflow that limits overall system capacity, creating delays and reducing productivity. Research from the Harvard Business Review shows that identifying and resolving these constraint points can boost your bottom line by an average of $50,000-$200,000 annually for businesses with 10-50 employees.
Why Visual Workflow Documentation is Your Ultimate Business Optimization Tool
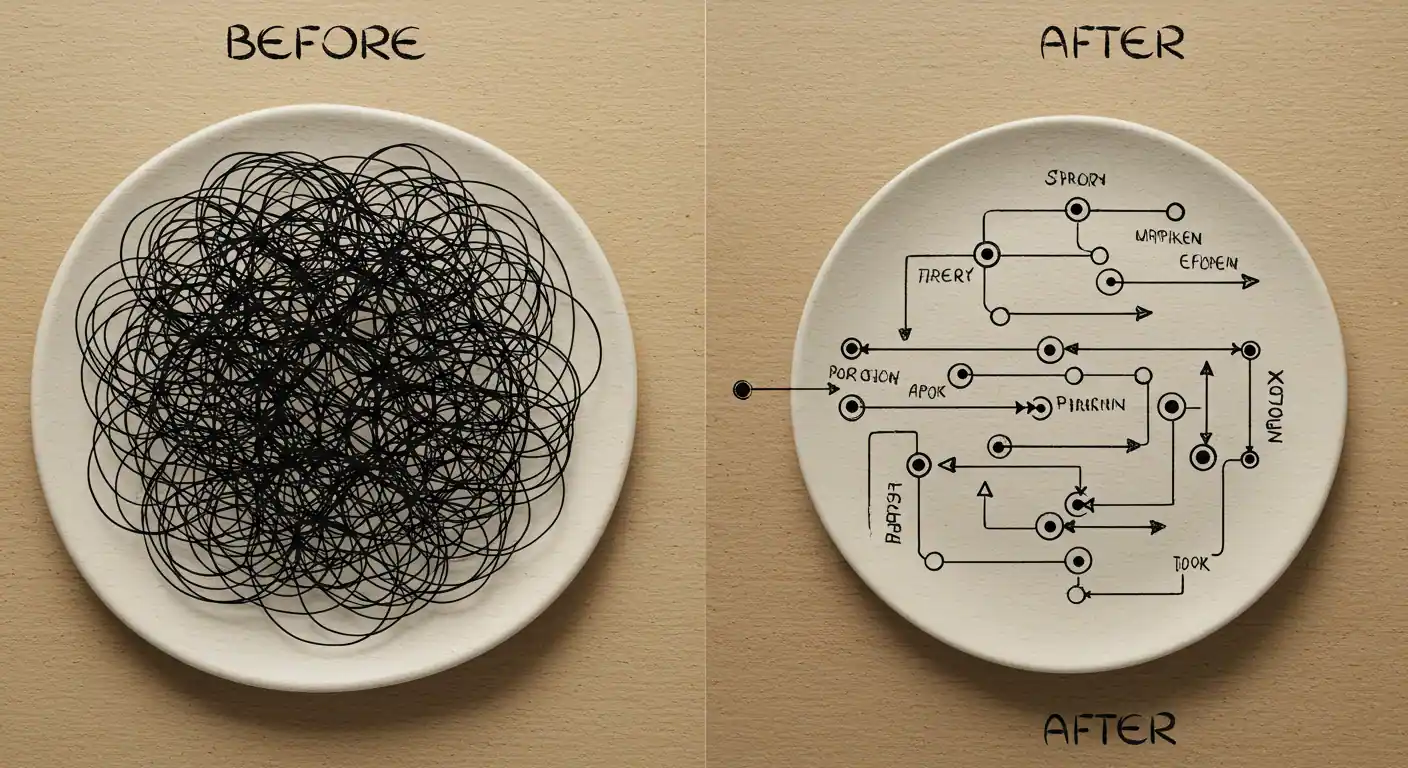
You can’t fix what you can’t see. Process mapping makes the invisible visible in your business operations.
As a business owner in today’s competitive US market, you have mental models of how your operations should work. However, what you envision versus actual day-to-day execution often reveals significant gaps. Business process mapping extracts these workflows from your head and transforms them into actionable visual documentation.
This strategic approach enables you to:
- Gain Complete Operational Visibility: Visualize end-to-end workflows, identifying all steps, decision points, and stakeholders involved
- Eliminate Hidden Inefficiencies: Discover redundant tasks, non-value-added activities, and resource waste that’s costing you money
- Pinpoint Revenue-Killing Bottlenecks: Find exactly where work gets stuck and how these constraints impact your profit margins
- Accelerate Employee Onboarding: Reduce training time by 60% with clear, documented processes new hires can follow immediately
- Build Scalable Operations: Create the foundation for systematic growth without losing quality or control
Process mapping serves as the cornerstone for implementing continuous improvement methodologies like Lean Six Sigma, helping you compete effectively with larger enterprises by optimizing what you already have.
The 5-Step Business Optimization Framework: From Chaos to Cash Flow
Our proven framework prioritizes quick wins and immediate ROI over complex theoretical approaches.
Step 1: Select ONE High-Impact Process
Don’t try to map everything simultaneously. Choose a process that meets these criteria:
- High frequency and volume (daily/weekly execution)
- Generates frequent customer or employee complaints
- Shows inconsistent timing and unpredictable outcomes
- Involves multiple departments or stakeholders
- Directly impacts revenue generation or customer satisfaction
Step 2: Define Clear Start and End Points
Establish Process Boundaries
Trigger Event: The specific action or condition that initiates the process
Completion Criteria: The measurable outcome that indicates successful process completion
Example: Customer places online order → Customer receives product and confirms satisfaction
Step 3: Assemble Your Process Execution Team
Include the people who actually perform the work daily, not just managers. Their frontline knowledge is crucial for mapping reality versus aspirational workflows. Apply the 70/30 rule: 70% frontline executors, 30% supervisory oversight.
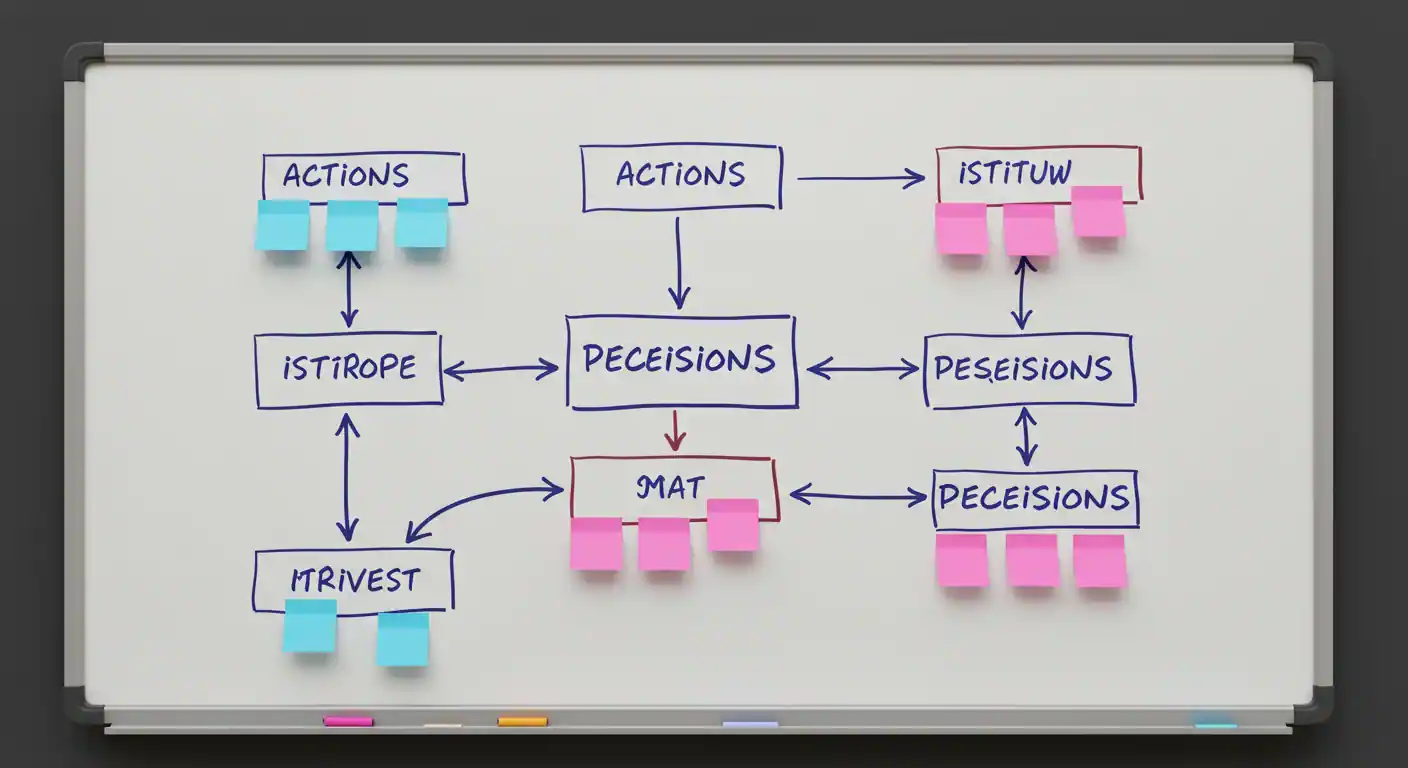
Step 4: Create Visual Documentation
Use accessible tools that your team can easily understand and update:
- Physical Approach: Whiteboard + colored sticky notes for immediate collaboration
- Digital Solutions: Miro (free tier), Microsoft Visio, or Lucidchart for remote teams
- Document Everything: Each step, decision point, responsible party, and average completion time
- Include Exception Handling: What happens when things go wrong?
Step 5: Identify and Quantify Bottlenecks
Look for these red flags that signal constraint points:
- Steps requiring significantly longer processing time than others
- Work accumulation and queue buildup
- Resources operating at 90%+ capacity consistently
- Frequent process breakdowns or exception handling
- Customer escalations or internal complaints
????️ Custom Workflow Mapping Generator
Define your process parameters and receive a customized mapping framework tailored to your business.
???? Your Personalized Process Framework
Advanced Bottleneck Analysis: Data-Driven Optimization Techniques
1. Throughput Analysis for Capacity Planning
Measure your system’s processing capacity to identify maximum output potential:
Throughput Calculation Framework
Throughput = Total Output Units ÷ Time Period
Example: Processing 150 customer orders in 8 hours = 18.75 orders/hour capacity
Benchmark: Compare against industry standards and competitor performance
2. Little’s Law for Workflow Optimization
This fundamental principle helps balance work-in-progress with processing speed:
- Work-in-Progress (WIP): Amount of work currently being processed
- Cycle Time: Total time from process start to completion
- Throughput Rate: Speed at which work exits the system
- Formula: WIP = Throughput Rate × Cycle Time
3. Resource Utilization Analysis
Identify which resources are constraining your operations:
| Utilization Level | Status Indicator | Recommended Action | Expected Outcome |
|---|---|---|---|
| < 70% | ✅ Underutilized | Optimize or reallocate resources | Cost reduction opportunity |
| 70% – 85% | ⚡ Optimal Range | Monitor for trends | Maintain efficiency |
| 85% – 95% | ⚠️ High Utilization | Plan capacity expansion | Prevent bottlenecks |
| > 95% | ???? Critical Bottleneck | Immediate intervention required | Restore flow capacity |
Real-World Success Stories: Before & After Transformations
Actual case studies from small and mid-sized businesses across different US industries.
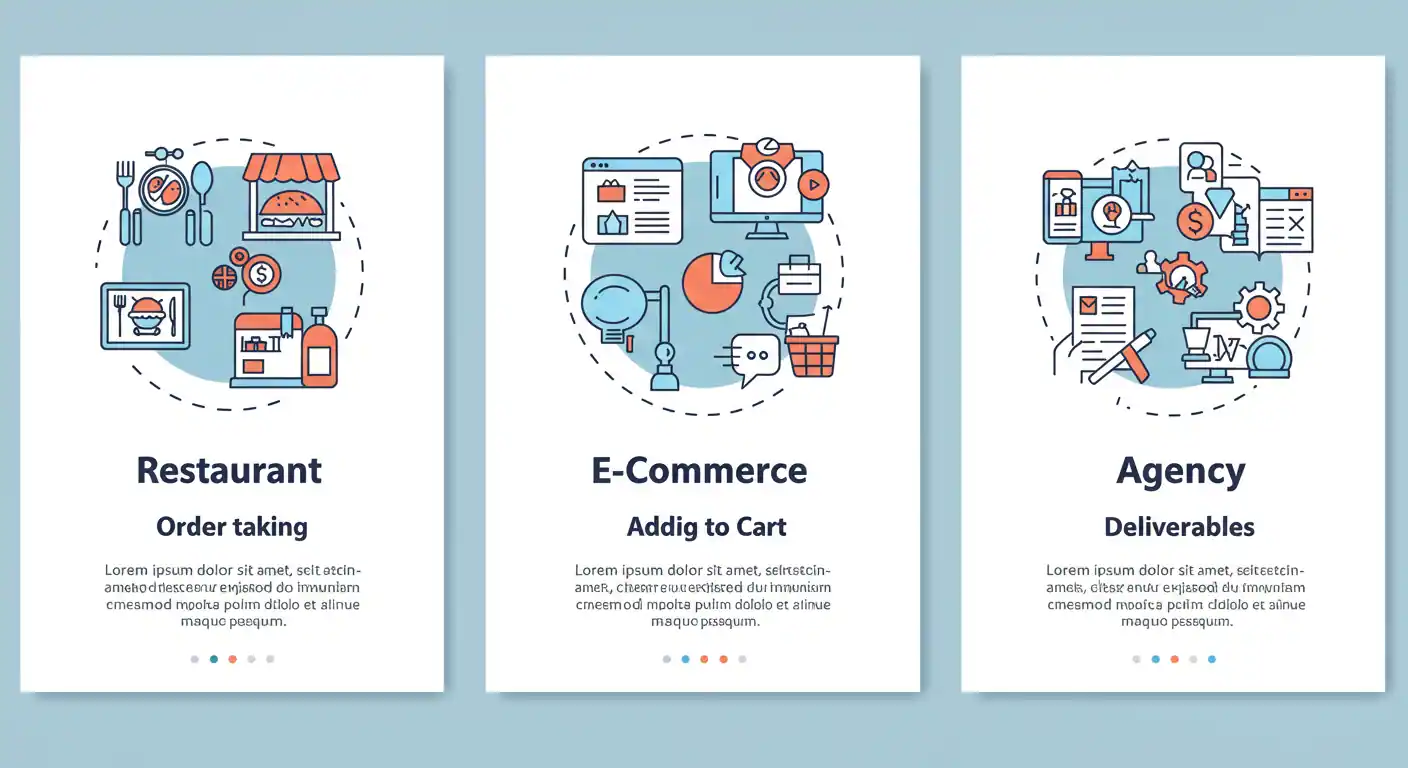
E-commerce Retailer (Austin, TX): From 4 Hours to 15 Minutes
Business: Outdoor gear retailer with $2M annual revenue
Challenge: Manual payment verification took 2-4 hours per order, limiting daily processing capacity
Results: 85% reduction in processing time, 75% fewer payment errors, $180,000 additional annual revenue from increased capacity.
Family Restaurant Chain (Phoenix, AZ): Table Turnover Revolution
Optimization Implemented:
- QR code ordering system reducing server touchpoints by 60%
- Kitchen display system eliminating paper tickets
- Contactless payment options (Apple Pay, Google Pay, tap-to-pay)
- Automated reservation confirmations via SMS
Results: 35% increase in table turnover rate during peak hours, 90% reduction in order errors, $85,000 increase in quarterly revenue.
Professional Services Firm (Denver, CO): Client Onboarding Acceleration
| Metric | Before Optimization | After Implementation | Improvement |
|---|---|---|---|
| Onboarding Duration | 12-18 business days | 3-5 business days | 75% faster |
| Document Requests | 15-25 back-and-forth emails | 3-5 structured communications | 80% reduction |
| Client Satisfaction Score | 7.4/10 | 9.2/10 | 24% improvement |
| Required Documentation | 12-18 different forms | 5-7 consolidated documents | 65% simplification |
Best-in-Class Tools for US Small Businesses
Micro & Small Businesses (1-10 employees)
Free & Low-Cost Solutions:
- Microsoft Visio Online: $5/month, integrates with Office 365 ecosystem
- Lucidchart Starter: Free for up to 3 documents, perfect for initial mapping
- Draw.io (now diagrams.net): Completely free, exports to multiple formats
- Miro Free Plan: 3 editable boards, excellent for team collaboration
Mid-Size Companies (11-100 employees)
Professional Solutions:
- Lucidchart Professional ($12/month): Advanced templates, real-time collaboration
- Microsoft Visio Plan 2 ($15/month): Full desktop application with cloud sync
- Creately ($8/month): Specialized in business process documentation
- SmartDraw ($12/month): AI-assisted diagramming with extensive template library
Enterprise & Growing Companies (100+ employees)
Enterprise Solutions:
- Bizagi Modeler: Free for modeling, enterprise version for automation and analytics
- Signavio: Comprehensive process mining and optimization platform
- ARIS by Software AG: Complete enterprise architecture and process management
- Celonis Process Mining: AI-driven process discovery and optimization
???? Small Business Strategy
Start with free tools to prove ROI, then scale up as your process optimization program matures. The methodology matters more than the technology – focus on building the discipline of continuous improvement first.
30-Day Implementation Roadmap for Immediate Results
Week 1: Foundation & Discovery (Days 1-7)
Week 1: Foundation & Discovery (Days 1-7)- Day 1-2: Select your highest-impact process using the criteria outlined above
- Day 3-4: Assemble your process team and schedule initial mapping session
- Day 5-6: Choose your mapping tool and set up workspace (physical or digital)
- Day 7: Define clear process boundaries, triggers, and completion criteria
Week 2: Mapping & Documentation (Days 8-14)
- Day 8-10: Conduct collaborative mapping sessions with your team
- Day 11-12: Document current state workflow with all steps and decision points
- Day 13-14: Validate mapping accuracy with process executors and stakeholders
Week 3: Analysis & Optimization (Days 15-21)
- Day 15-17: Identify bottlenecks using throughput and utilization analysis
- Day 18-19: Design optimized future state workflow
- Day 20-21: Calculate expected ROI and implementation requirements
Week 4: Implementation & Measurement (Days 22-30)
- Day 22-25: Implement quick wins and low-cost improvements
- Day 26-28: Train team on new workflow procedures
- Day 29-30: Measure results and plan next process optimization cycle
???? Success Metrics to Track
Process Efficiency: Cycle time reduction, error rates, resource utilization
Business Impact: Cost savings, revenue increase, customer satisfaction scores
Team Performance: Employee productivity, stress levels, job satisfaction
Frequently Asked Questions
For small businesses, dedicate 2-3 hours weekly to process improvement activities. This includes mapping sessions, bottleneck analysis, and implementation of quick wins. The key is consistency – regular small improvements compound into significant operational gains over time.
Start with customer-facing processes that directly impact revenue: order fulfillment, customer onboarding, or service delivery. These typically offer the highest ROI and most visible improvements to your customers and bottom line.
Involve your team in the mapping and improvement process from day one. When employees help identify problems and design solutions, they become champions of change rather than resistors. Focus on how improvements make their jobs easier, not just more efficient.
Track three key metrics: (1) Time savings multiplied by hourly wage costs, (2) Error reduction and associated correction costs, (3) Increased capacity and potential revenue growth. Most small businesses see 3:1 to 5:1 ROI within 90 days of implementation.
Absolutely. Service businesses often have more complex processes with multiple touchpoints. Focus on client journey mapping, project delivery workflows, and communication protocols. Professional services firms typically see the highest gains from process optimization.
???? Transform Your Business Operations Today
You now have the complete framework to eliminate bottlenecks, optimize workflows, and boost your profitability by 25-40%. The question isn’t whether process optimization works – it’s whether you’ll implement it before your competitors do.
Remember: Perfect processes don’t exist, but optimized ones drive profits. Start with one high-impact workflow, apply our proven methodology, and watch your operational efficiency transform your bottom line.
Start Your 30-Day Optimization ChallengeJoin 15,000+ business owners who’ve transformed their operations using these exact strategies. Every business deserves to run at peak efficiency – yours included.
Comments are closed.